Connect systems, build workflows and enable real‑time visibility
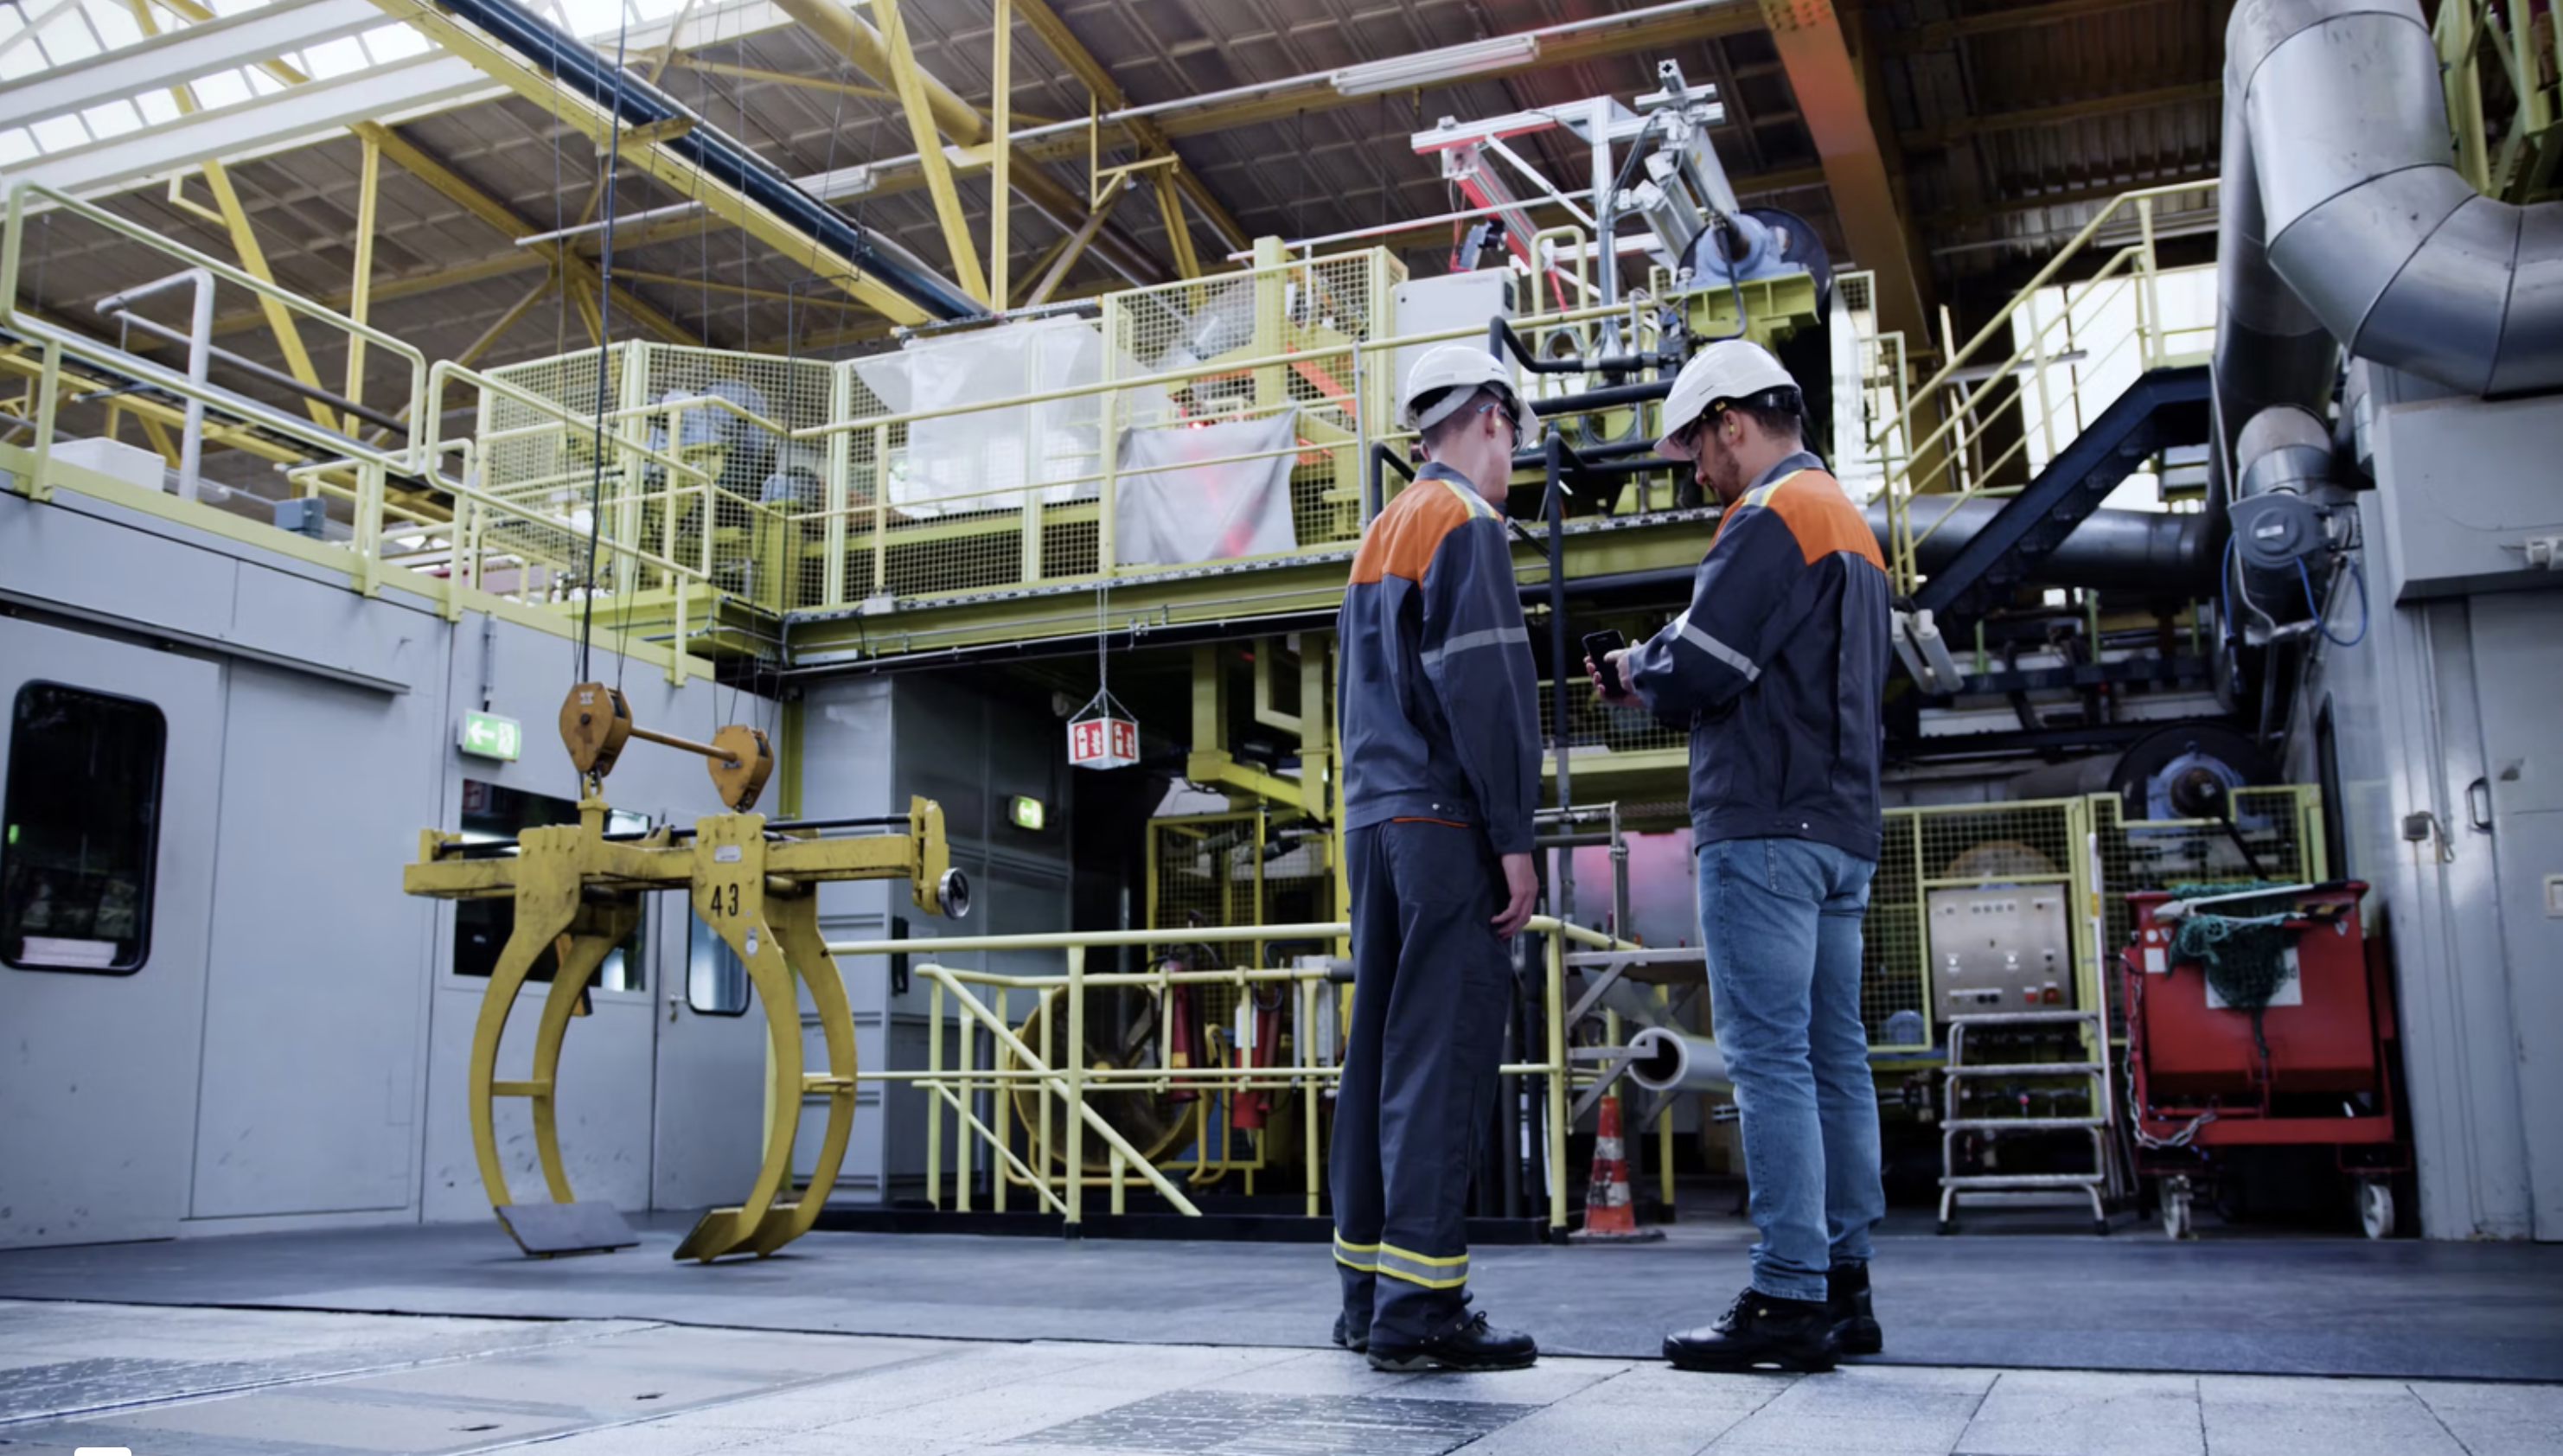
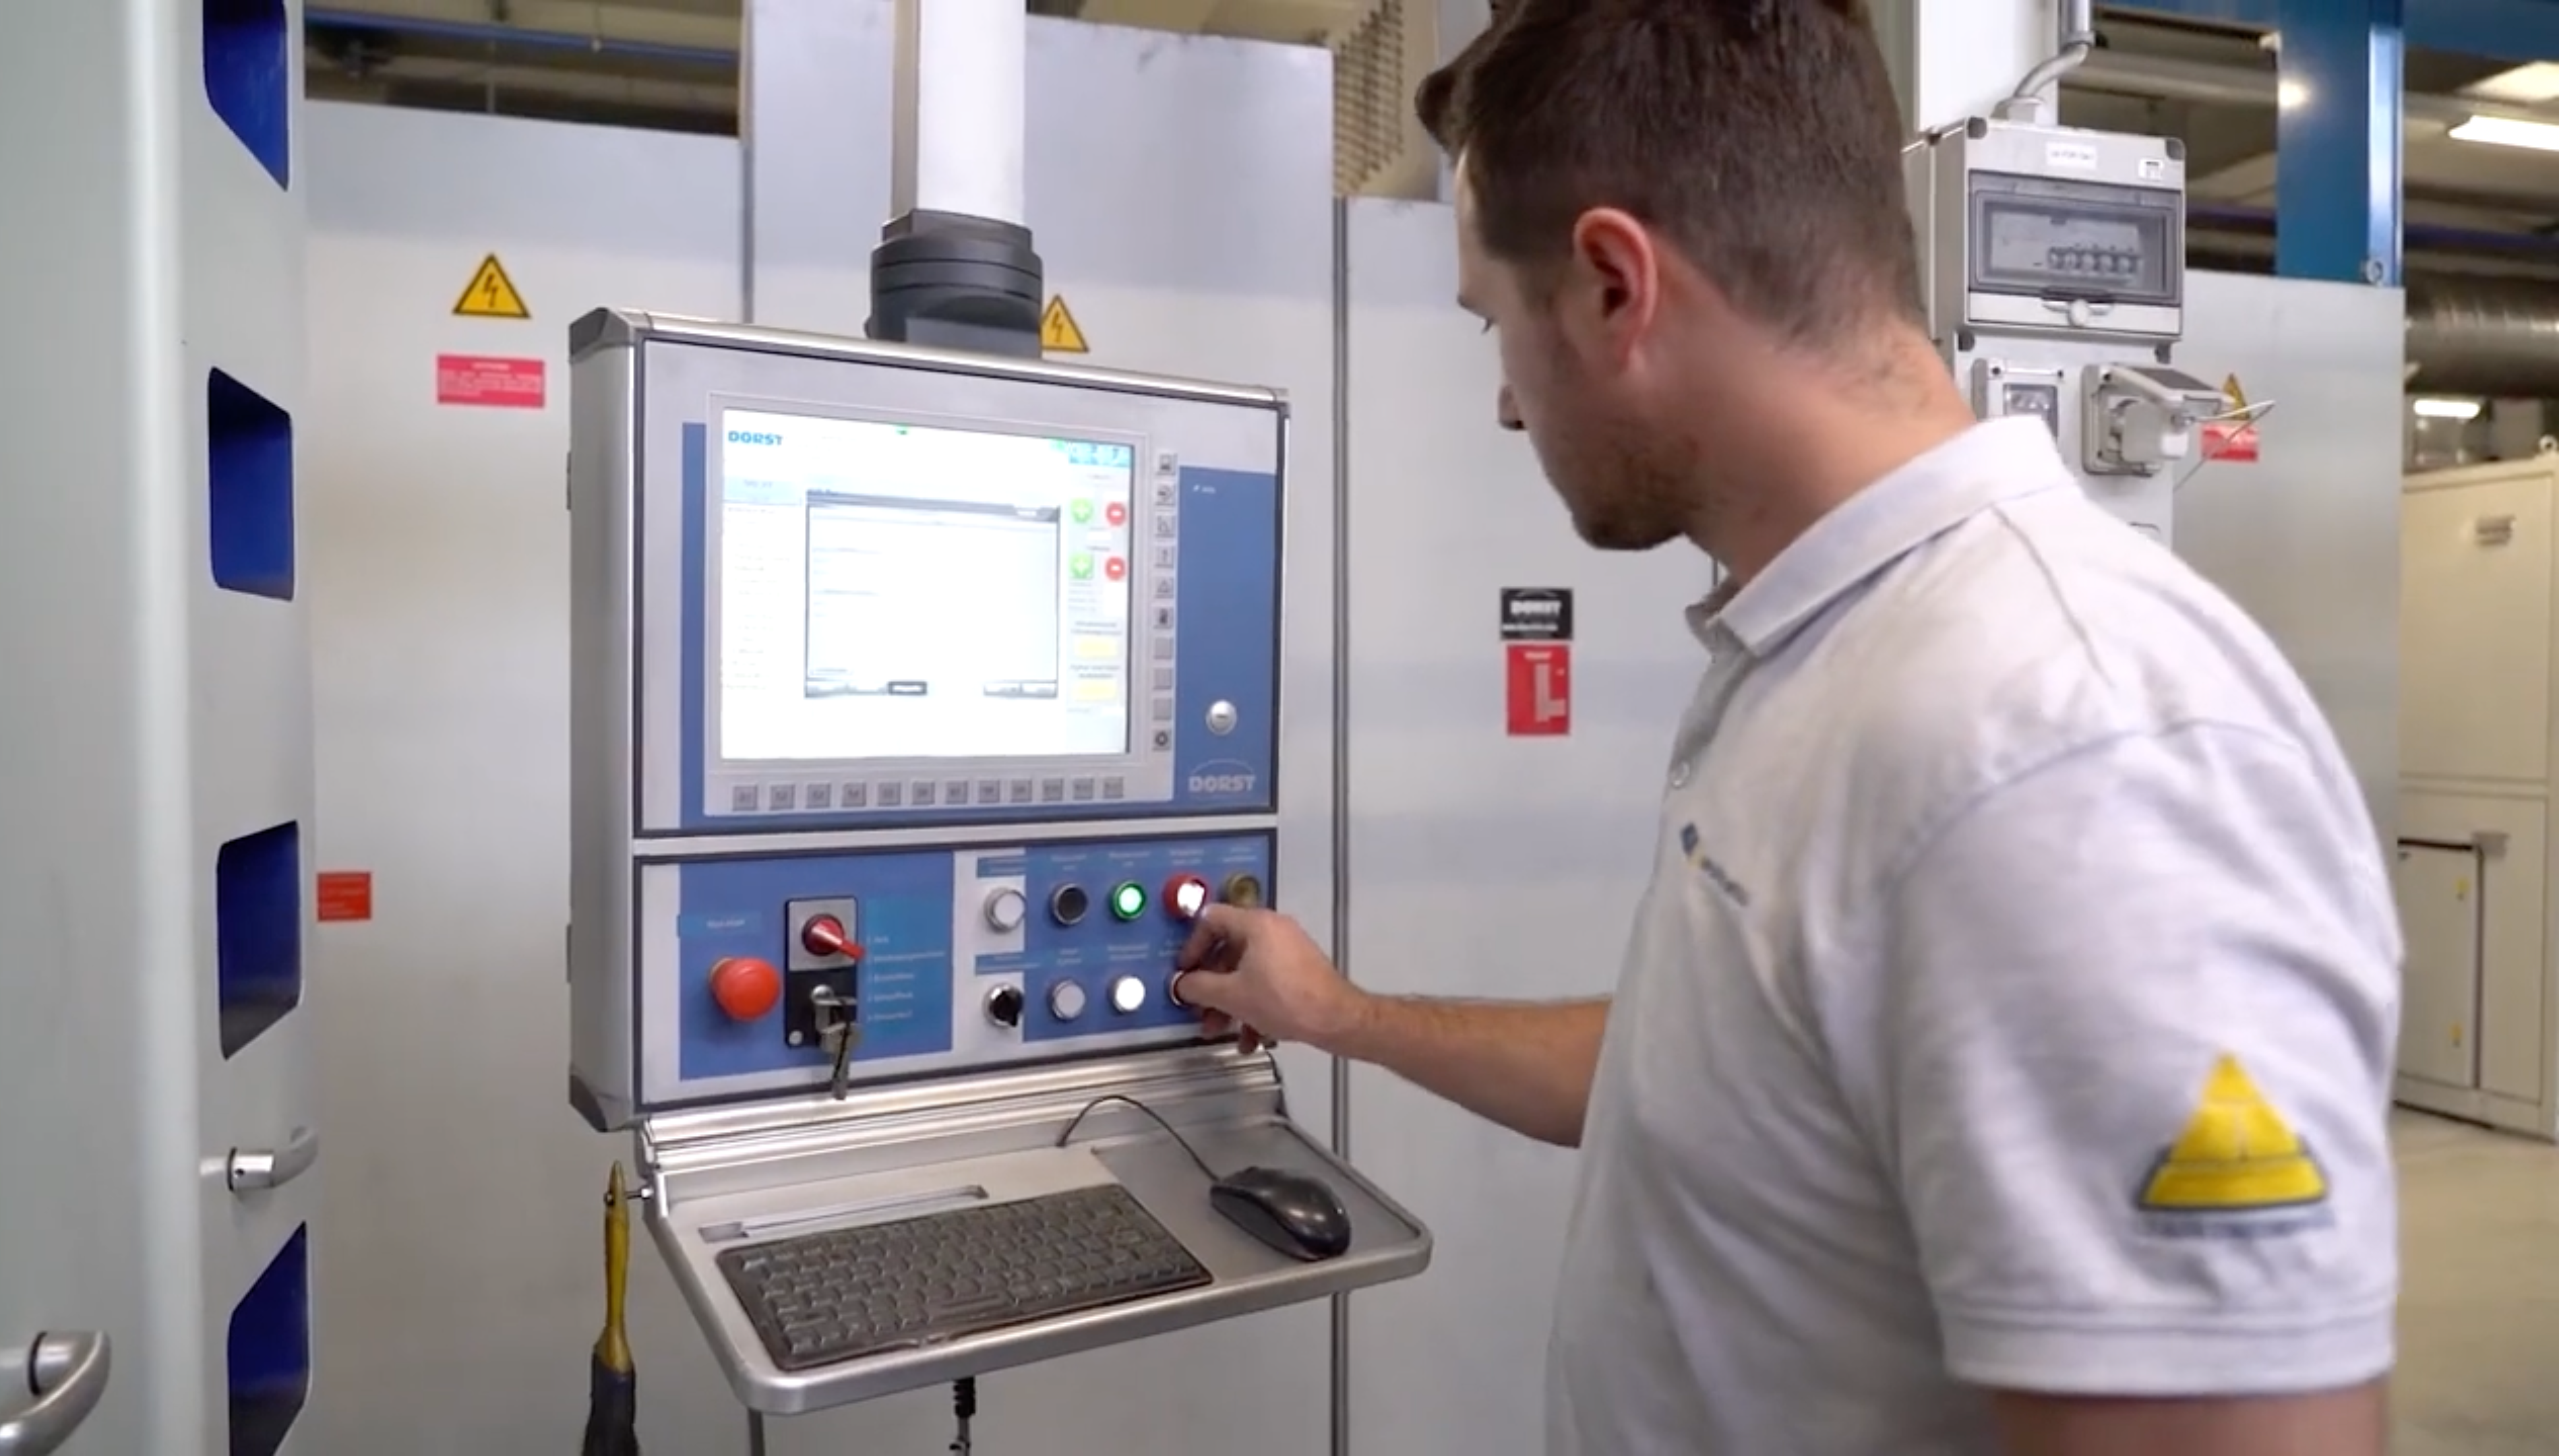
Fast digitization of all shop floor activities
Digitize lean processes, eliminate paper and accelerate continuous improvement
Turn paper instructions into interactive media accessible anywhere
Collect real‑time data and trigger follow‑up actions
Capture and share operational knowledge to prevent knowledge drain
QR‑code access to documents, data and apps when needed
Resolve production issues quickly with streamlined communication
Build flexible workflows that adapt to real‑time production data
Quickly build and roll out production apps with no code
Connect machines and systems through built‑in and custom connectors
Real‑time dashboards turn data into actionable insights
Automate training and manage skills with digital matrices
Standard apps for common manufacturing workflows, ready to deploy with Workerbase
Guide workers to ensure efficient, right‑first‑time assembly
Achieve zero defects with holistic quality processes
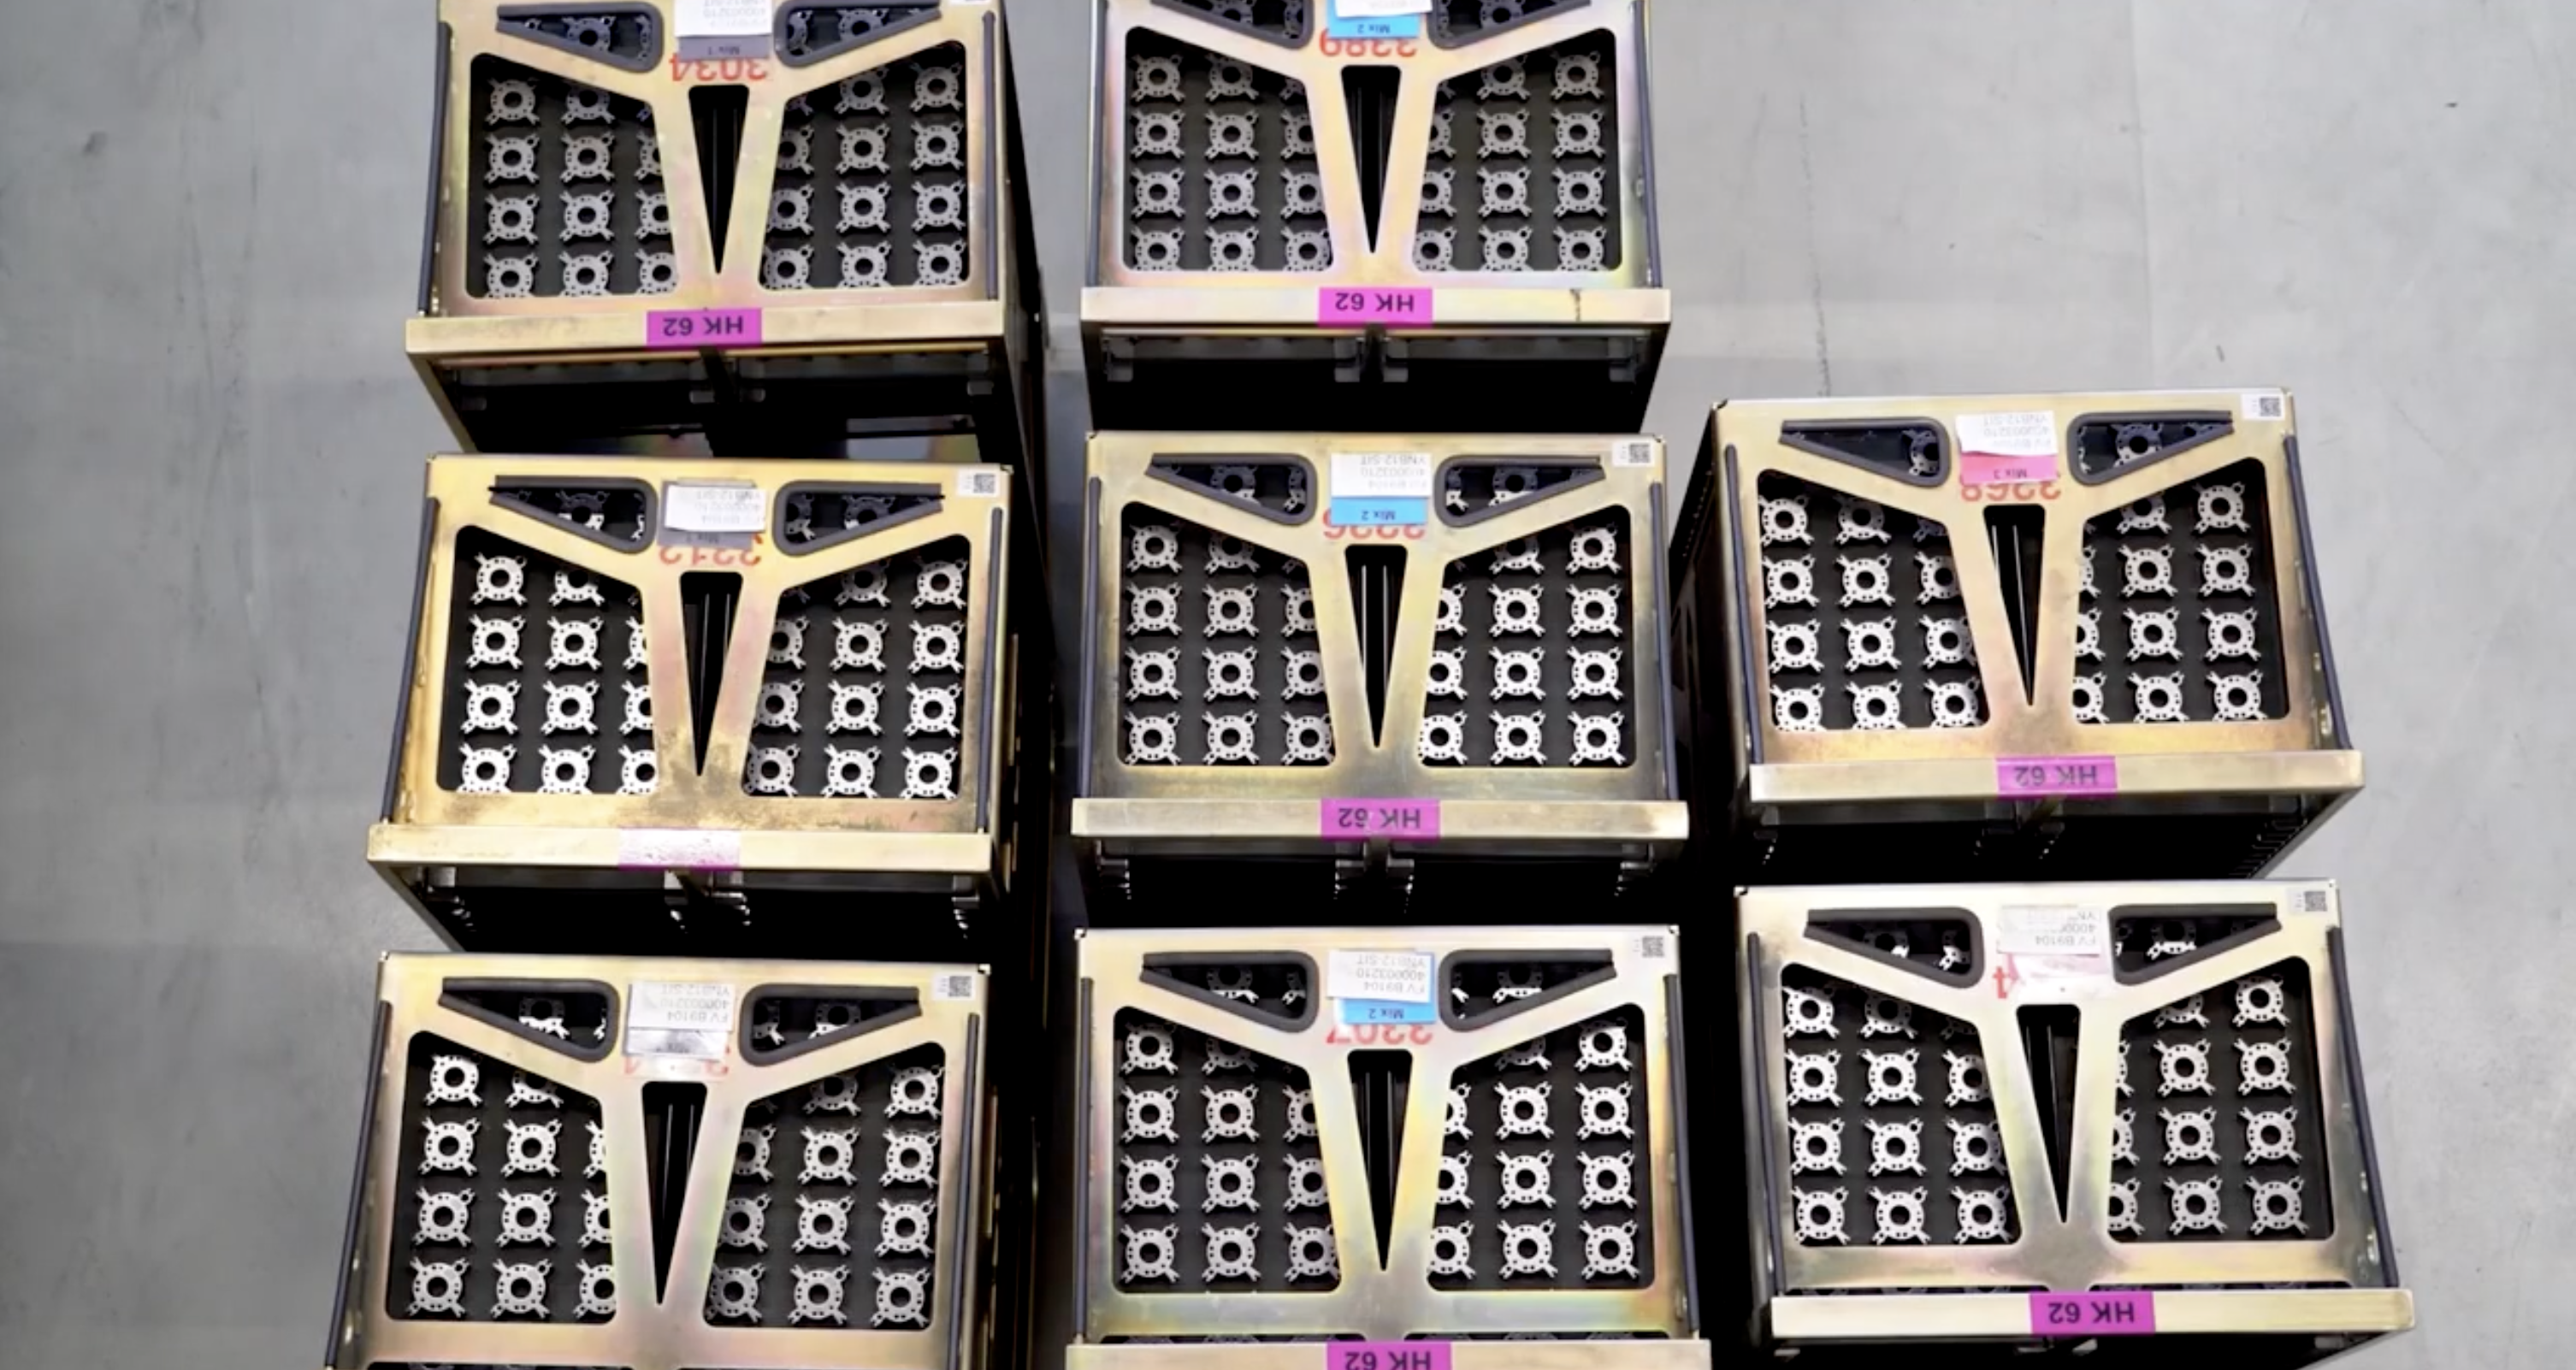
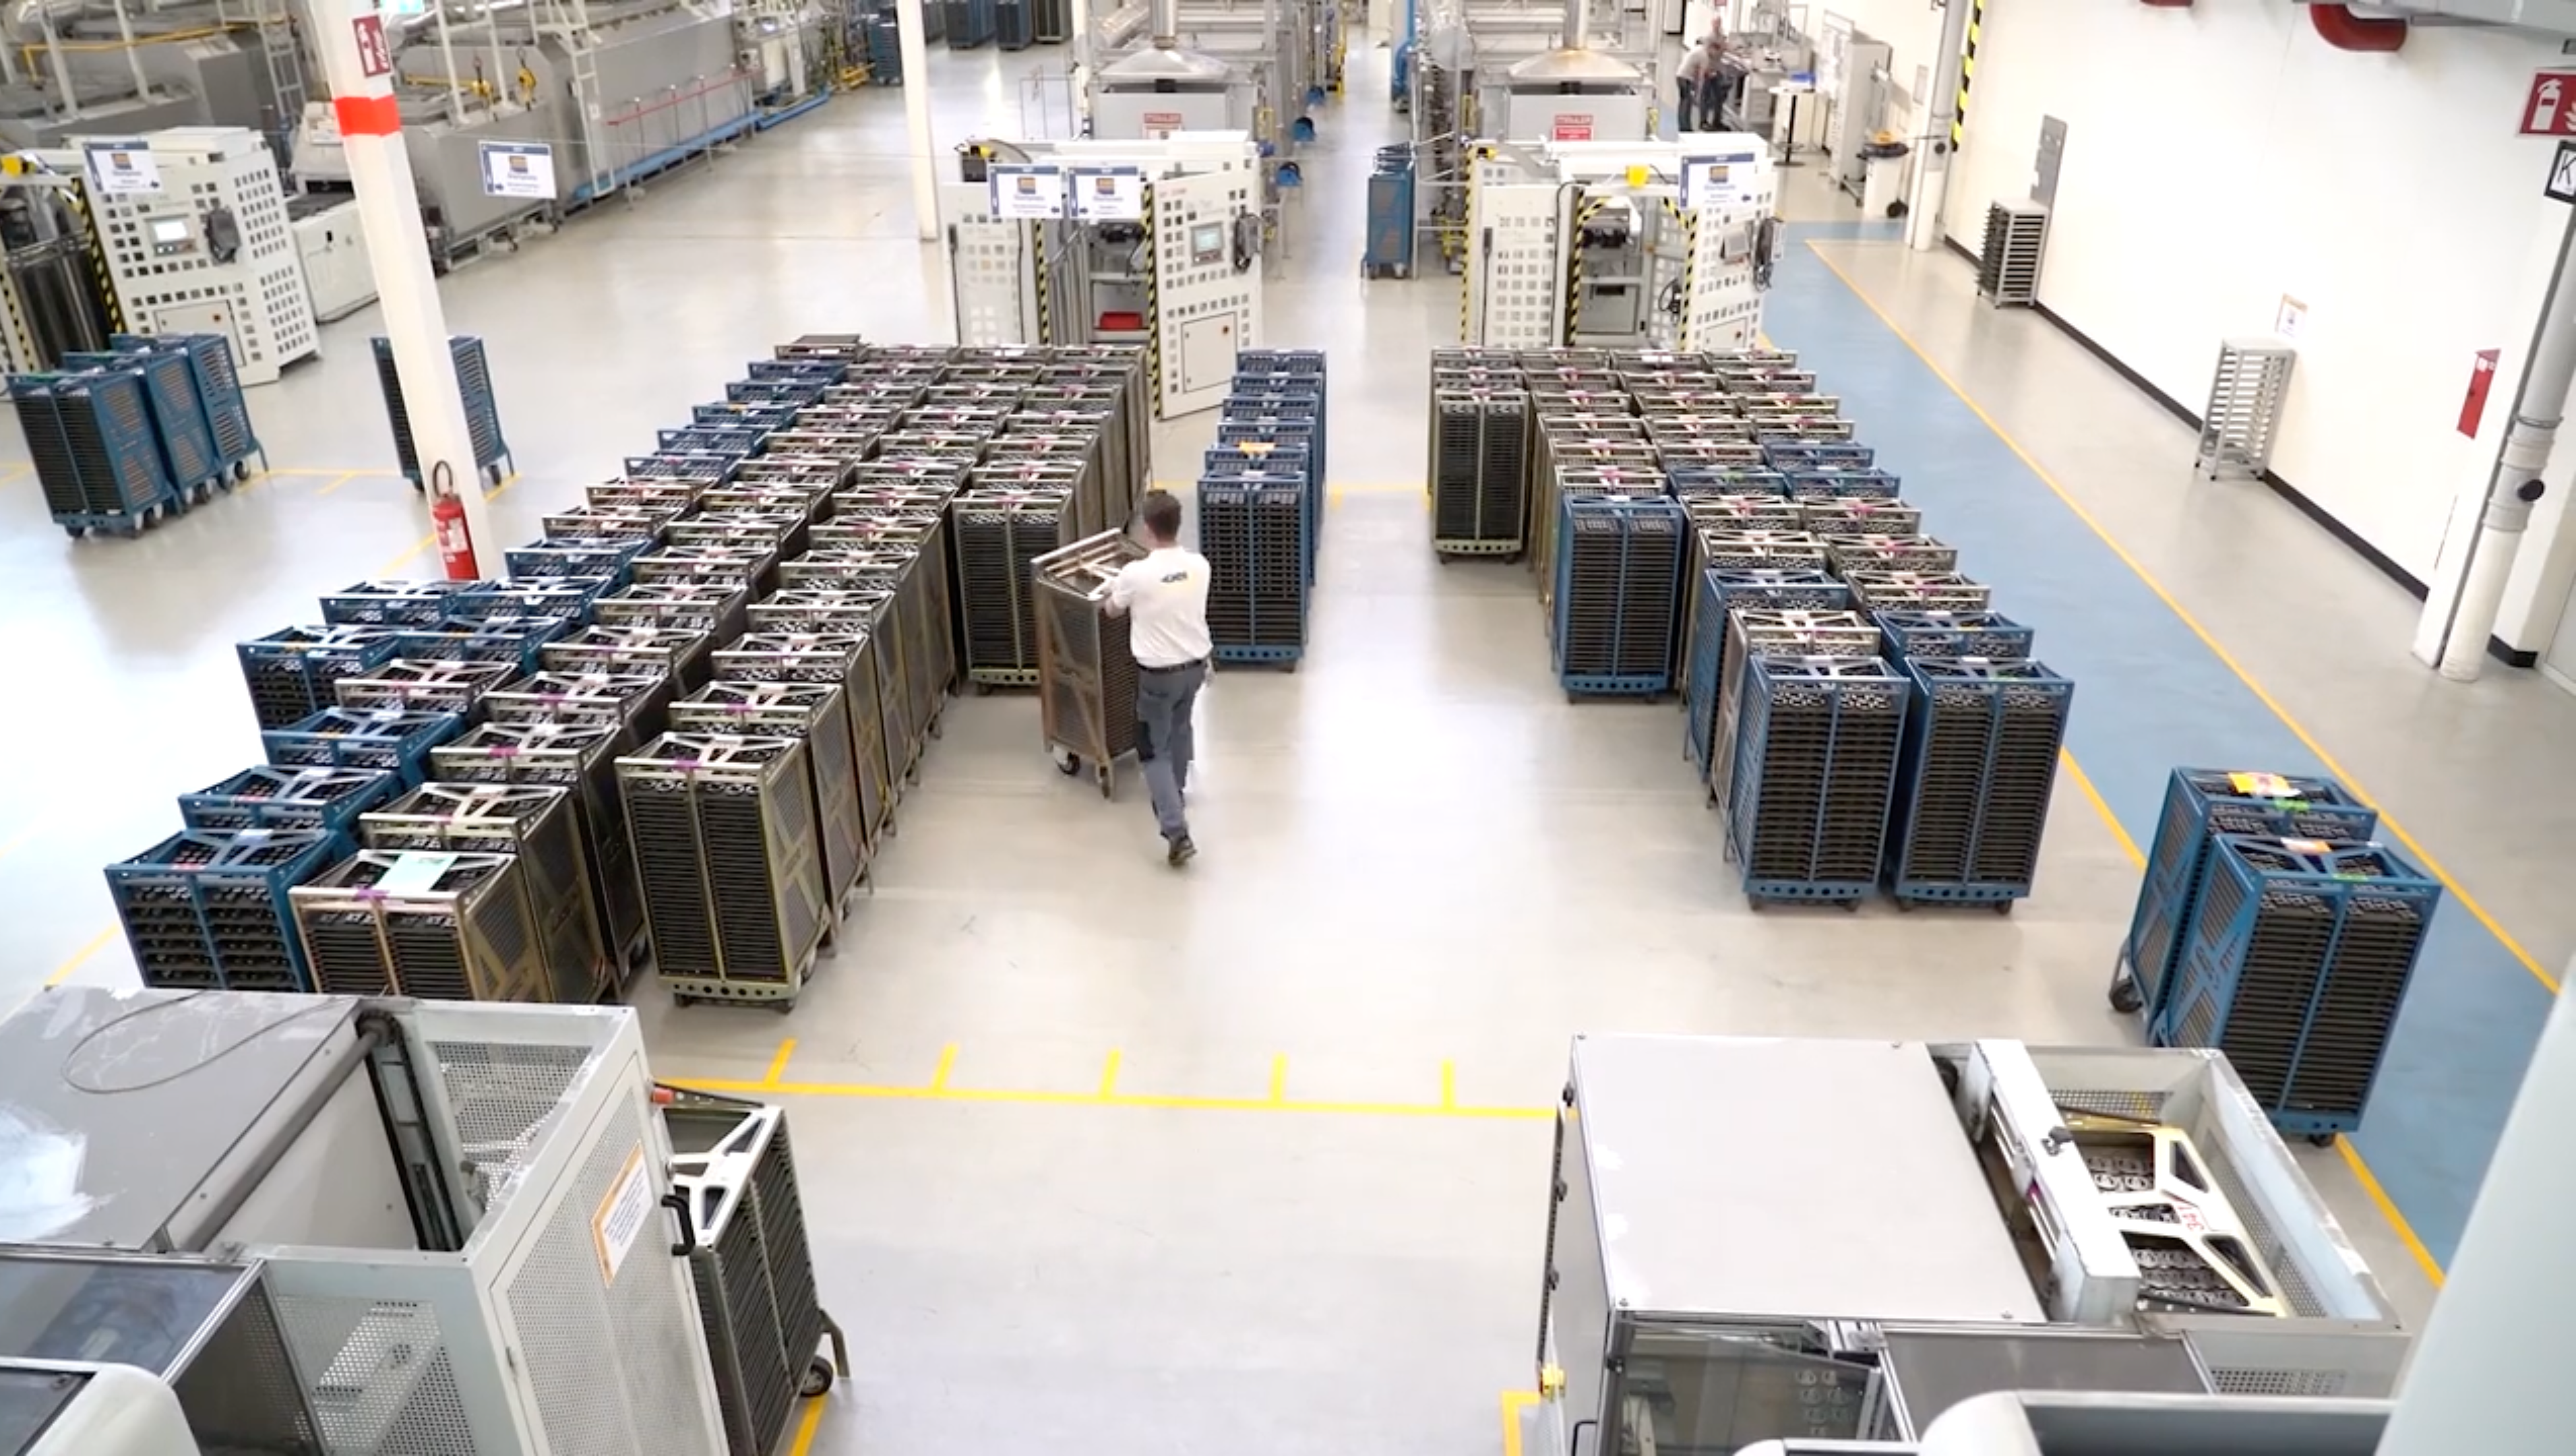
Streamline material handling and logistics using connected workflows
Resolve issues faster with a digital Andon system
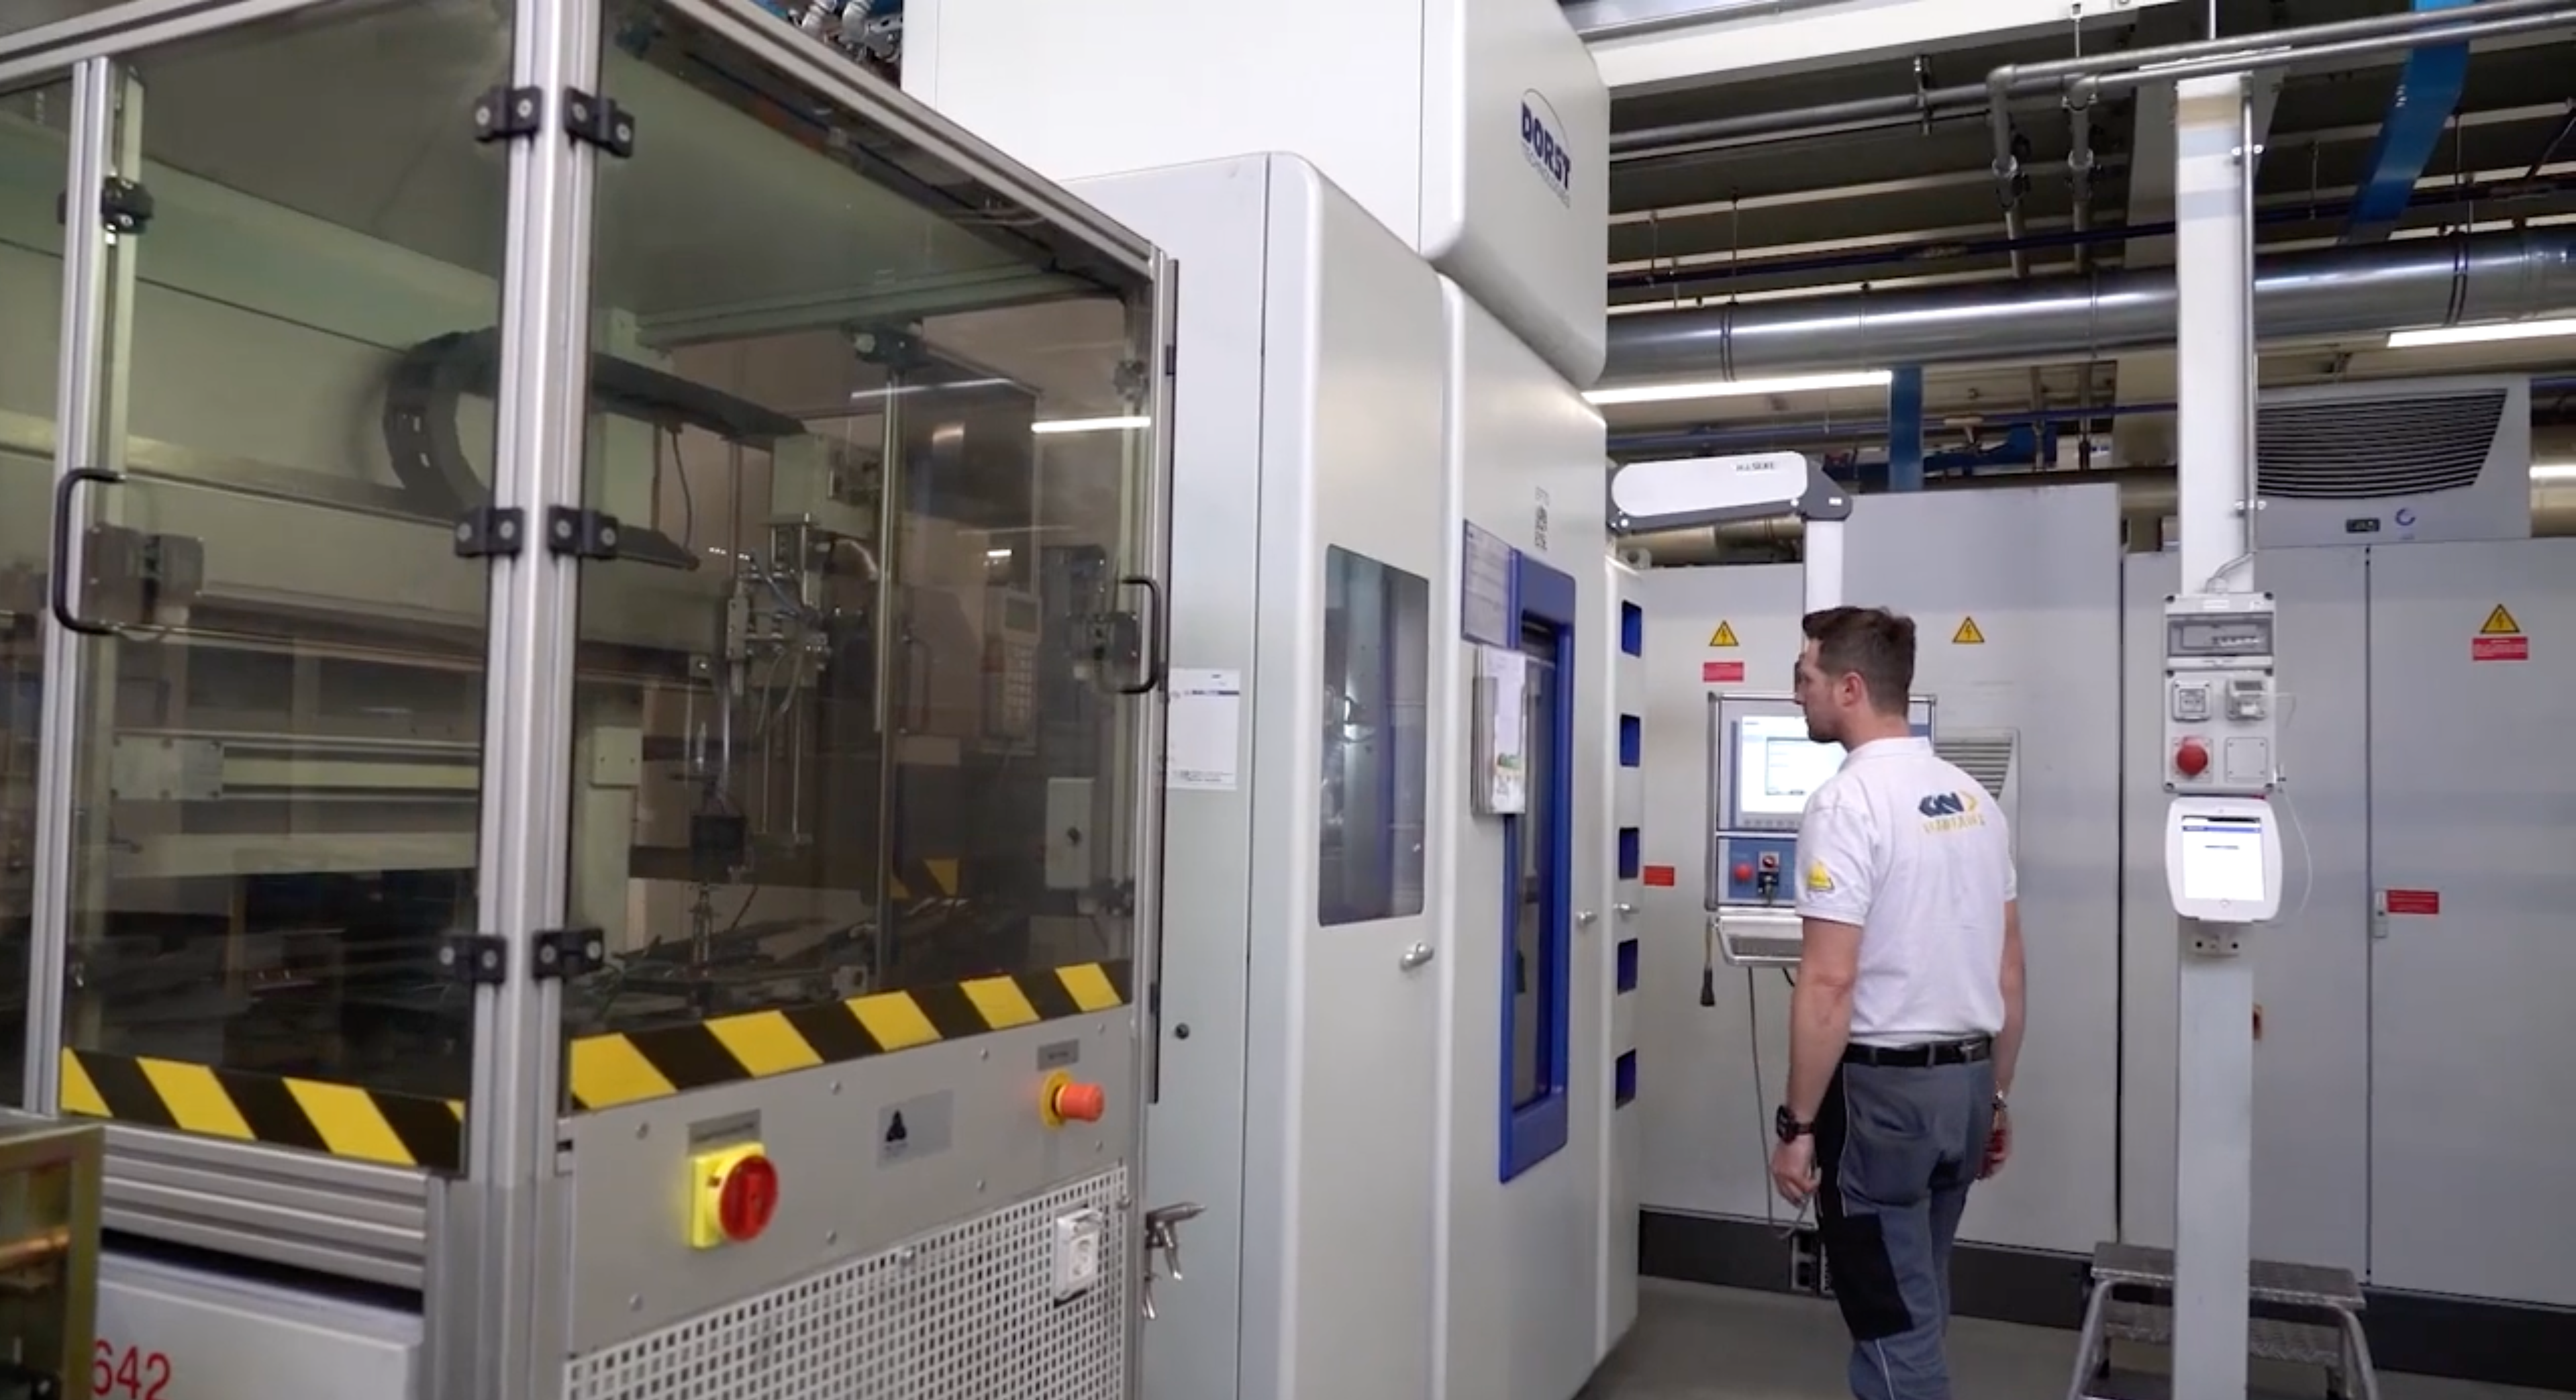
Reduce downtime and keep operations efficient
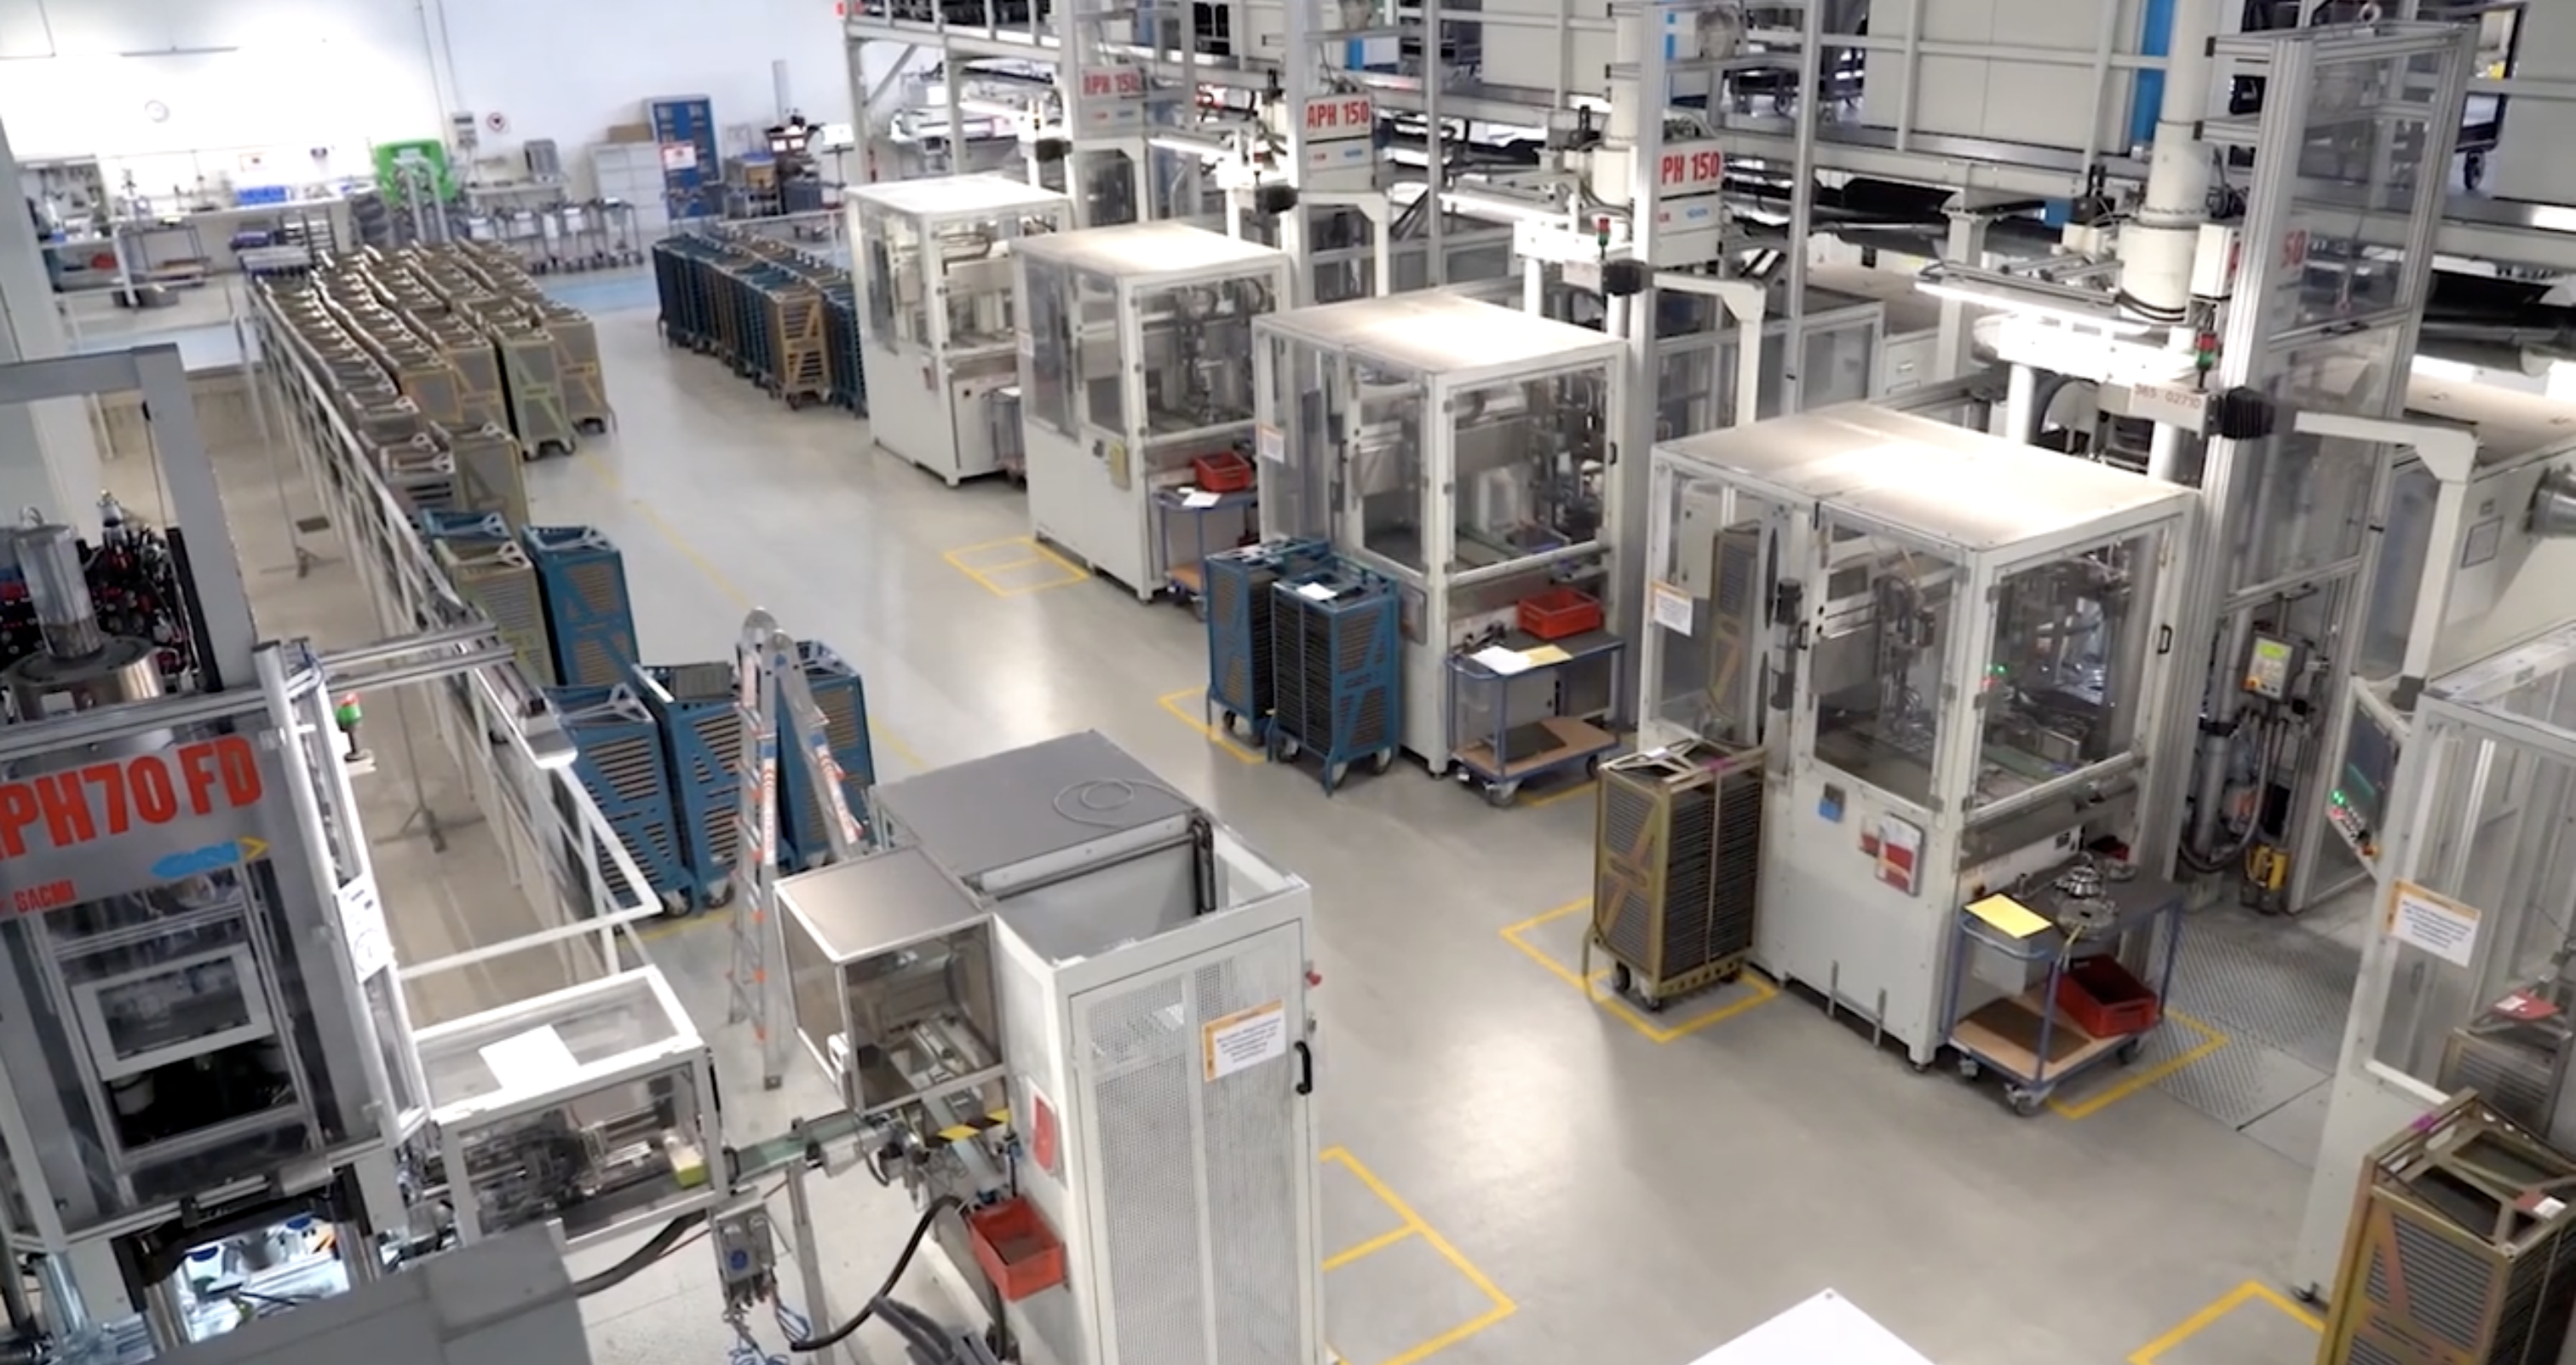
Digital apps to optimize discrete manufacturing processes
Increase SMT productivity and achieve ROI quickly
Prevent belt downtime and enable inline repairs
Gain production transparency and reduce mistakes
Ensure quality in regulated, complex production processes
Prevent scrap and eliminate unplanned downtime
Prevent mistakes and always be audit‑ready
Reduce scrap and optimise logistics with digital workflows
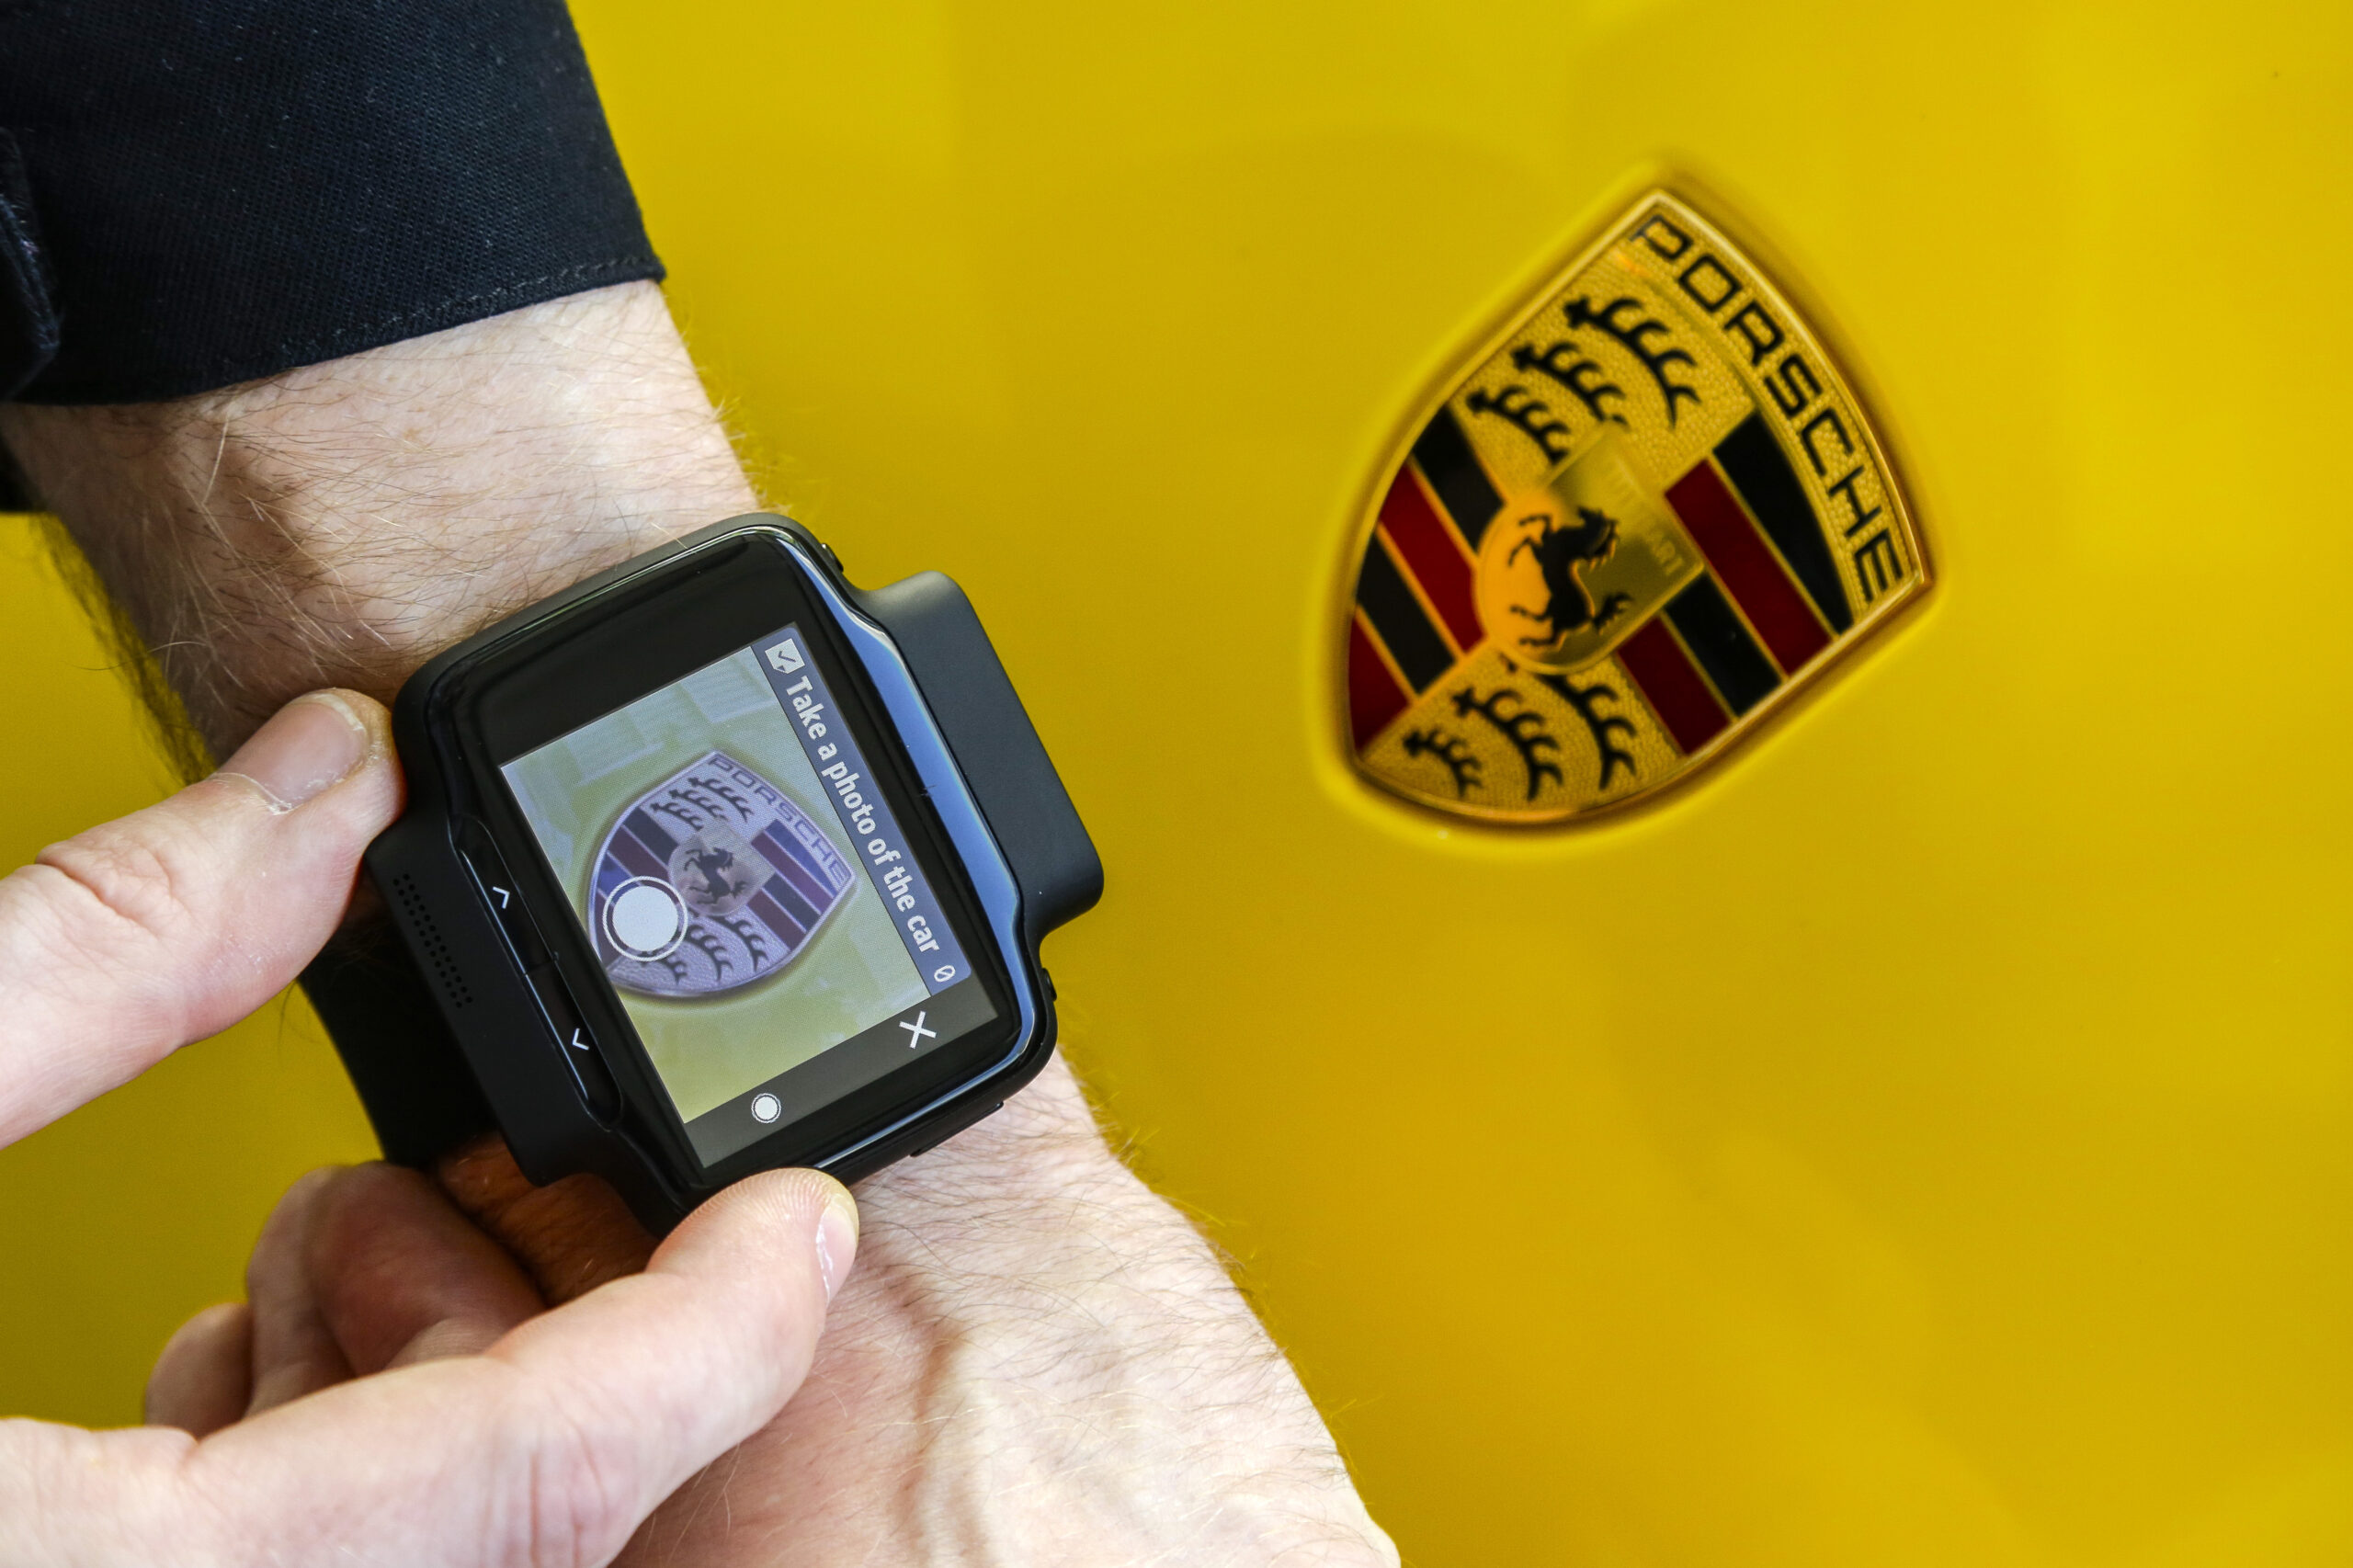
Rugged smartwatch delivers tasks and instructions instantly
Information on security, compliance and data protection
Insights on Connected Worker technology, digitization trends and product news
Our proven methodology to quantify value and ROI
Estimate potential inventory savings using Workerbase
Our experts help develop use cases to maximize value