Manufacturing generates vast amounts of data, often making it difficult to identify the most critical issues. The Pareto Chart, a simple yet powerful analytical tool, helps cut through the noise by highlighting the most impactful problems.
What is a Pareto Chart?
A Pareto Chart is a combination of a bar chart and a line graph that helps prioritize problems by identifying the most significant contributing factors. It is based on the Pareto Principle (80/20 Rule), which suggests that 80% of problems come from just 20% of causes. This principle is widely used in quality control, lean manufacturing, and continuous improvement efforts.
How a Pareto Chart Works
- Bars: Represent individual causes of a problem (e.g., defect types, machine failures, supply chain delays), arranged in descending order of frequency or impact.
- Line Graph: Displays the cumulative percentage of occurrences, highlighting how much each issue contributes to the total problem.

By visualizing data this way, manufacturers can quickly determine which areas need the most attention to drive the highest impact improvements.
Why is a Pareto Chart Useful in Manufacturing?
The primary benefits of Pareto charts are identifying the biggest contributing factors to inefficiencies and defects allowing teams to prioritize resolving issues that will have the greatest impact on performance. Additionally, it is inherently flexible to use with any issue as long as the causes have been identified.
However, for it to be effective it requires accurate data to be collected from the day-to-day operations on the factory floor.
How is the data collected?
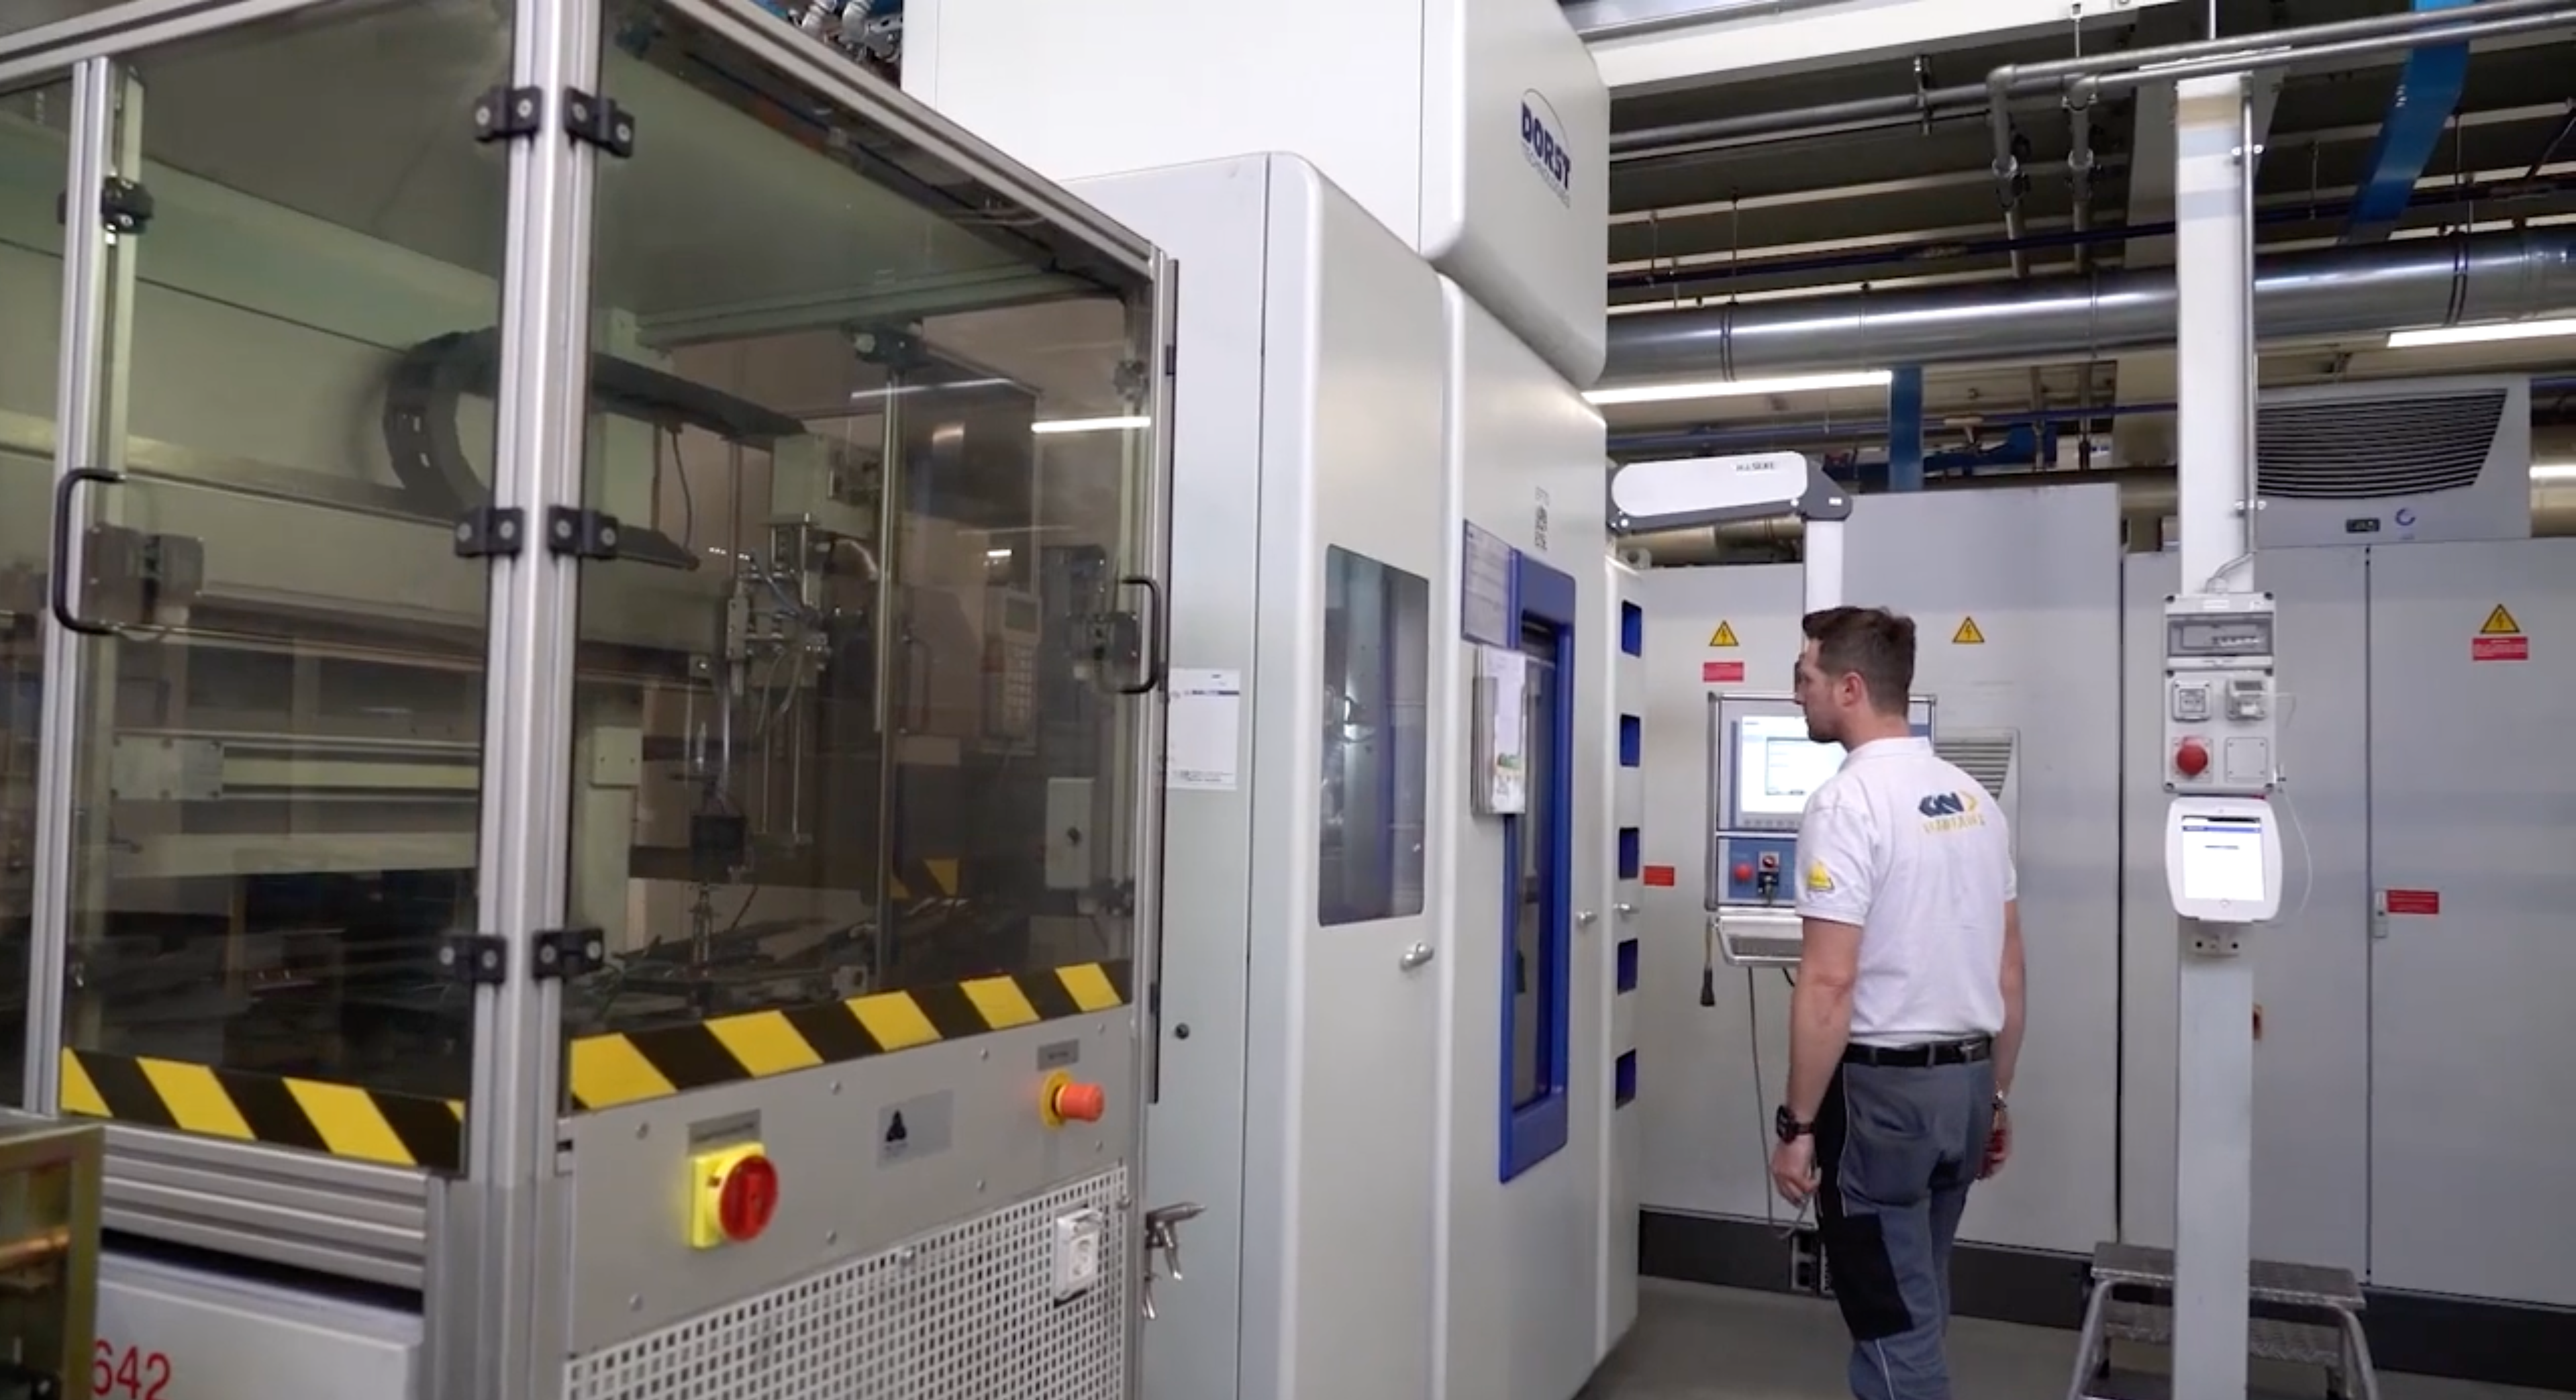
Traditionally, data was gathered by in-line measurements or manually tracked by workers onto paper-based forms. However, with the rise of digitization and the adoption of connected data acquisition systems, manufacturing data can now be collected in real time. For example, with Connected Worker Platforms like Workerbase, defect data can be collected in real-time and can be accessed on a mobile app or a smartphone.
Modern systems can automatically store all the data digitally and platforms like Workerbase can have in-built visualization functionalities that include Pareto diagrams. By analyzing manufacturing data, teams can plan accordingly based on data driven decision making to implement practices that have the biggest positive impact on the flow of operations.
Real-World Applications in Manufacturing
By combining Pareto charts with Connected Worker Platforms like Workerbase, manufacturers can take efficiency improvements to the next level. While Pareto charts help identify the most critical issues by visualizing where 80% of problems originate, Workerbase’s real time data collection and automated task management ensure that the necessary corrective actions are triggered immediately—directly onto workers’ personal devices. Instead of relying on manual follow-ups, issues like machine downtime, defects, or supply chain bottlenecks can be automatically assigned to the right person with clear steps for resolution. This combination can lead to significant improvements in varying aspects of manufacturing such as the cases listed below:
- Defect Reduction: Identifying the most common product defects and their causes.
- Downtime Analysis: Pinpointing the main reasons for machine stoppages and optimizing maintenance schedules.
- Supply Chain Issues: Understanding which factors contribute most to delays or inventory shortages.
- Customer Complaints: Determining the primary reasons for dissatisfaction and addressing them first.
Conclusion
In lean manufacturing, time and resources are limited, making it crucial to focus on the highest-impact improvements. Implementing Pareto charts using the Workerbase platform allows manufacturers to move beyond just identifying problems—to actually resolving them faster and more effectively.
By leveraging real-time data and automated task execution on personal devices, teams can proactively tackle inefficiencies, reduce downtime, and drive continuous improvement.